Plotly for Javascript and React
Create sophisticated, interactive charts in JavaScript for finance, engineering, and the sciences.
Plotly’s JavaScript library is free, open-source, and does not require an online plot.ly account. Download today on GitHub.
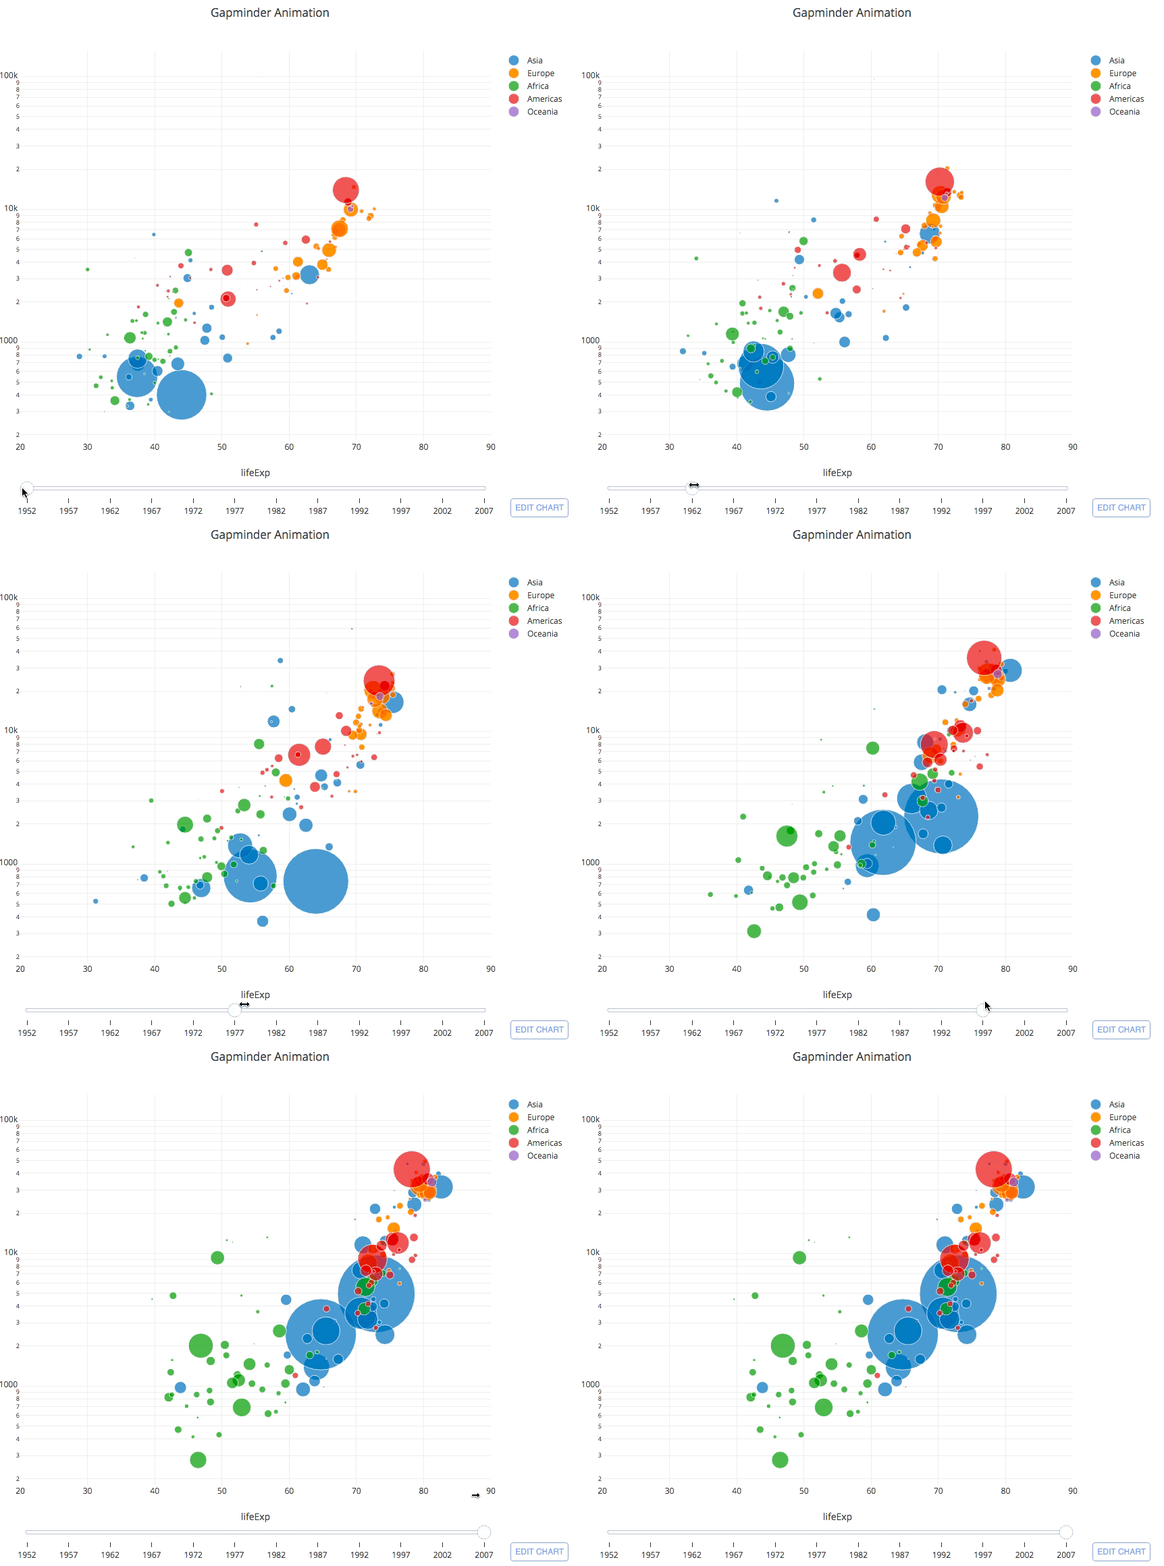
Create sophisticated charts for the Web with minimal JavaScript experience
Every major company in Science, Engineering, and Finance is moving their software to the Web. Plotly provides the Web data visualization technology supporting this trend.


Trusted By


Champion Performance
Plotly.js leverages WebGL to plot >1 million points in under four seconds for common chart types.
React Components for Data Visualization
Instantly add Plotly.js charts and pivot tables to your app with our drop-in React components - the same components used in our Chart Studio and Plotly dashboards.


Collaborate with Designers
Design your charts by clicking through Chart Studio’s GUI, then export the JavaScript code to publish the charts on your website.


Open Source
Help Steer the Roadmap
Have a big idea for a data visualization web app? We can help.
Plotly’s charting library has been developed in partnership with leading financial, pharmaceutical, governmental, and academic institutions.


