Dashboards & Reporting
Send online, interactive reports and dashboards to your customers and team.


Clean, minimalist, dashboards & reports
Clutter and confusion are not attributes of data - they are shortcomings of design.
- Edward Tufte
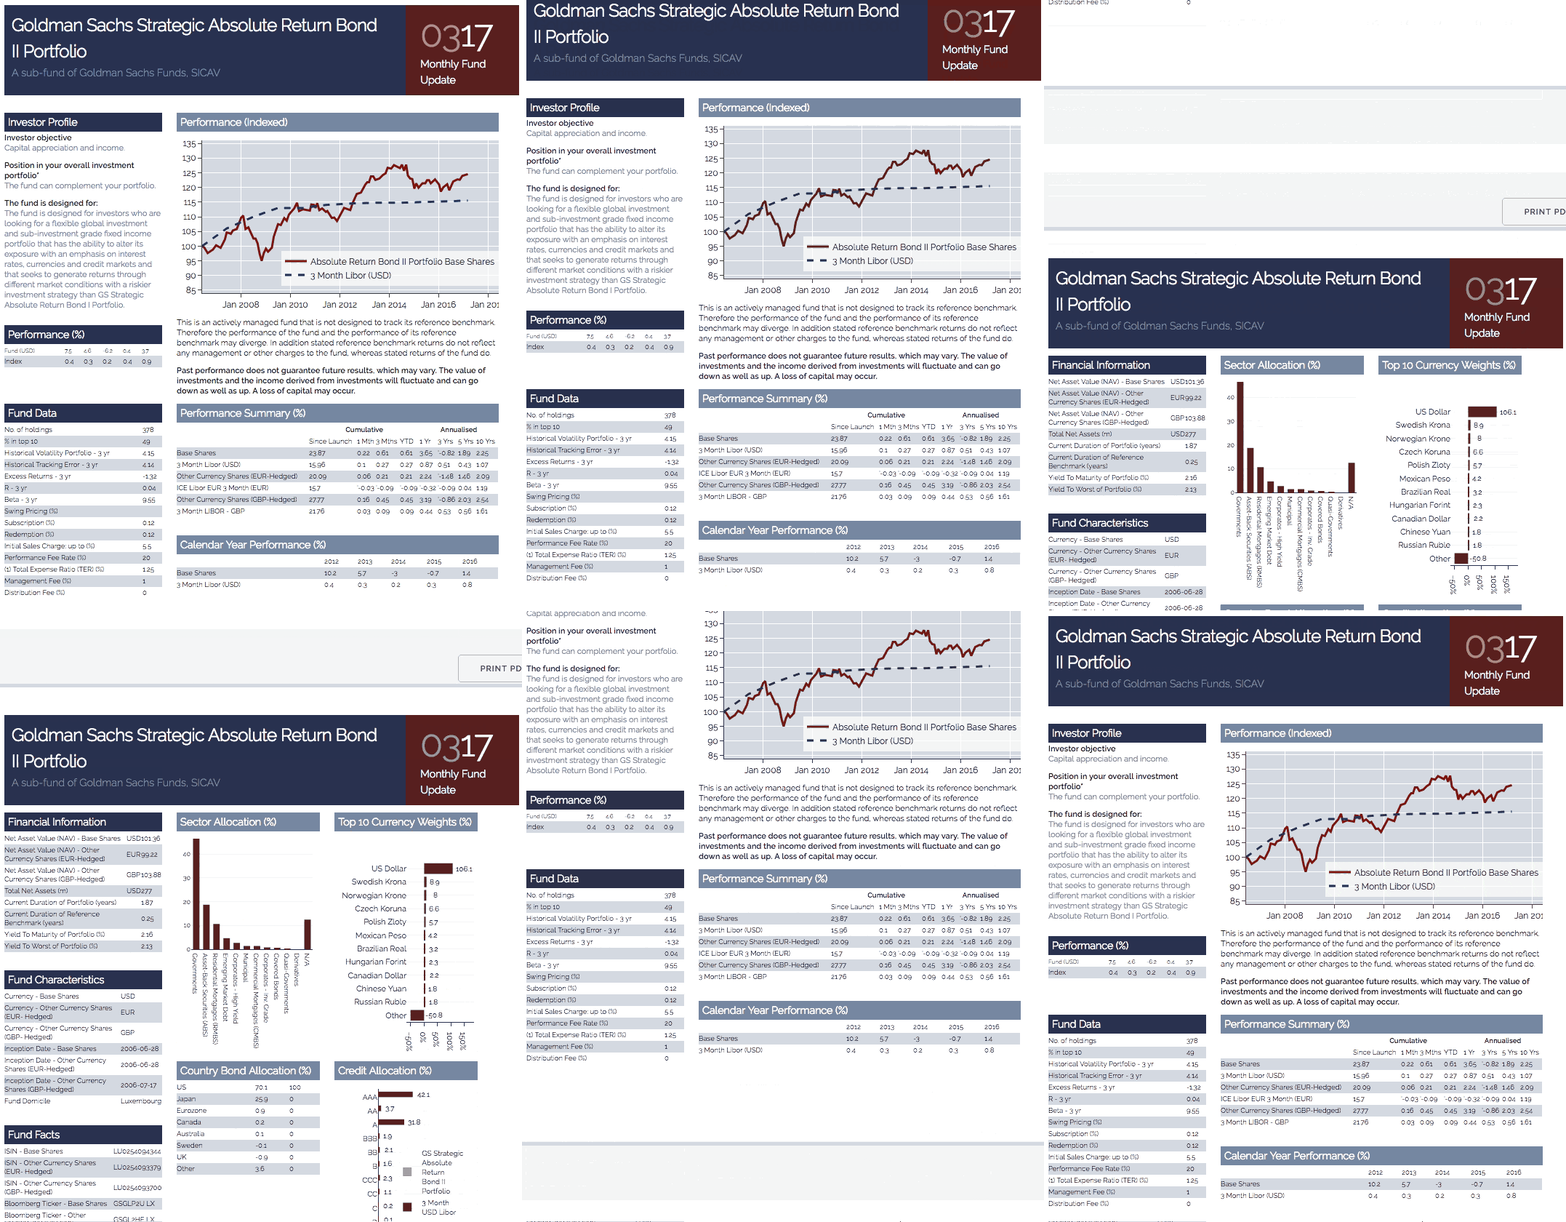
Plotly gives you the tools and examples to make beautiful dashboards and reports, even if you’re not trained in design.
D3.js charts without any code
Create interactive D3.js charts for your reports and dashboards in R, Python, or without writing code in Chart Studio.
Dashboards & reporting for every industry
Plotly dashboards appear in every industry — we’ve helped everyone from NASA’s Mission Juno to the local school board improve the presentation of their data with our dashboards, charts, and open-source software.
Seamless workflows for R and Python
Make your charts in R or Python, then add them to reports and dashboards using the online GUI. Coders and non-coders can collaborate through plotly for the first time.
Coordinated views with crossfilter
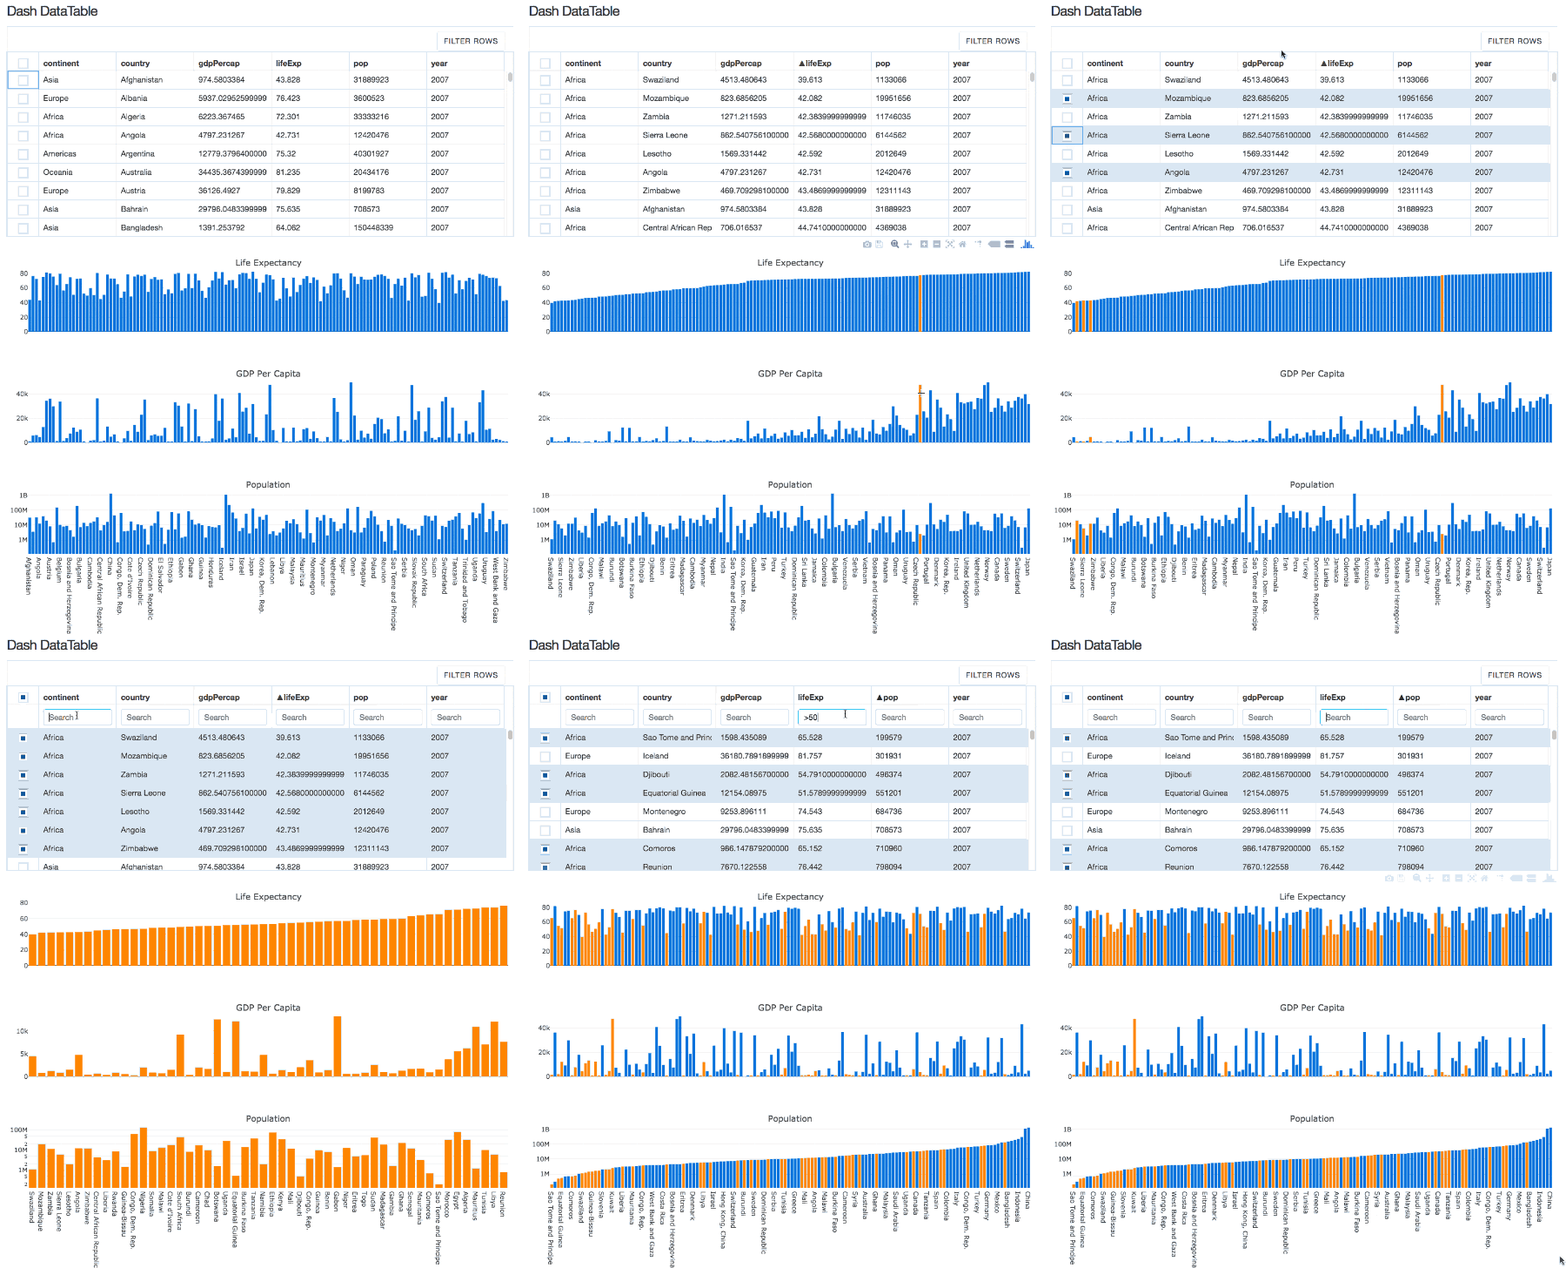
Interactively explore multivariate datasets in the browser. Selecting data in one chart highlights data of the same rows in the charts arounds it.
Modern, web-based reporting
Use our rich text editor and made-to-print layout to compose reports with interactive D3.js charts.
Customizable, interactive controls
Enhance your reports and dashboards with a suite of code-free widgets:
- Text search bar
- Chart hover text
- Legend toggling
- Crossfilter
Take your reports and dashboards to the next level with Dash
Looking for more?
Dash lets users make rich analytic apps in only a few hundred lines of Python.
Using Dash, you can easily compose apps and dashboards that have:
- Dropdowns
- Filters
- Chart data brushing
- Click, hover, and keyboard callbacks
- Data upload
- Calendar date selection
- And much more


