Plotly for R and Shiny
Create interactive, D3 and WebGL charts in R.
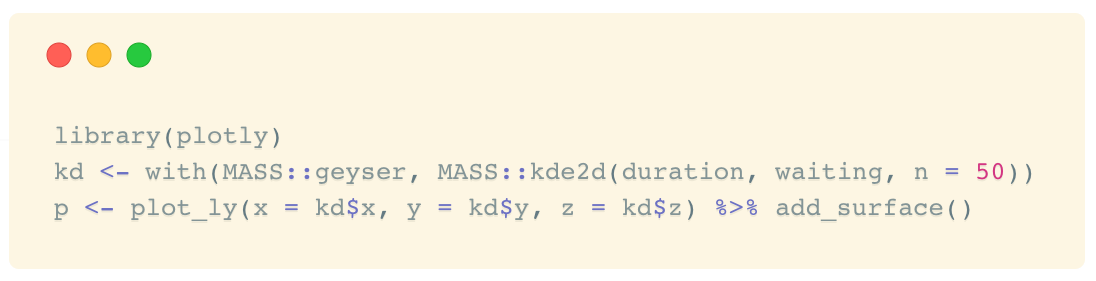
Plotly’s R library is free, open-source, and does not require an online plot.ly account. Download today with CRAN or devtools:
install.packages("plotly")

No fuss web graphics for R
It’s the charting library from 2040. We’re setting a new standard for interactive charting in technical computing:
- Interactive by default.
- Language agnostic.
Instead of saving as images, charts are serialized as JSON and can be read in R, Python Julia, MATLAB, or JavaScript. - Embeddable & editable on the Web.
- Vector export for print publication.


Trusted By


... and more than 500,000 user downloads.
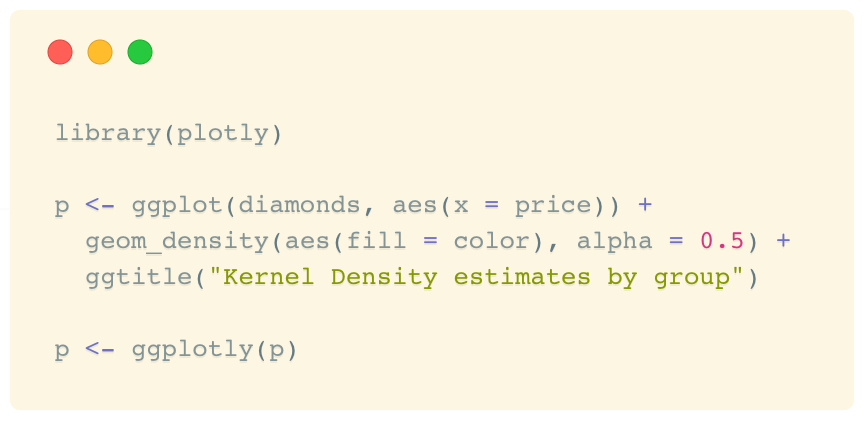
Convert ggplot2 graphs to interactive versions with ggplotly()
With one line of code, convert your ggplot2 graph to an interactive, Web embeddable version.


Export charts from RStudio to edit online, place inside dashboards, and share with coworkers
Create charts in R, then use Chart Studio to made edits, inspect the chart’s JSON, and share with your team or customers.


Interactive visualization for Shiny and Dash
Supercharge your Shiny app with advanced, interactive visualization.
Need a boost? We can develop Shiny apps for you or help you along your way.
R and Shiny Visualization Workshops
Bring your team’s data visualization skills to a new level with a workshops.
Can’t attend a workshop? Purchase a developer support plan to boost your team through its next project.
Help Steer the Roadmap
Have a big idea for data visualization in R? We can help.
Plotly’s R library have been developed in partnership with leading financial, pharmaceutical, governmental, and academic institutions.